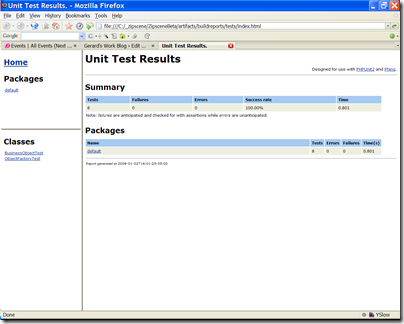
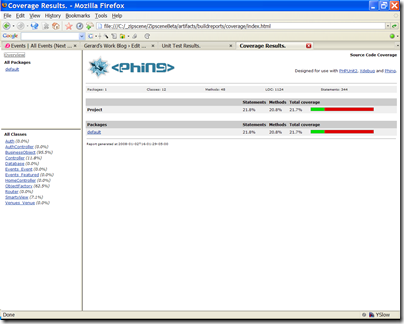
If we are to do unit testing, then it would be nice to have a simple way to run all the tests at once. And seeing the results in a command line is fine, but it would be nice to be able to generate some pretty reports I could view in a browser. And running coverage tools from the command line to see exactly what we’re testing is fine, but it would be nice to be able to generate coverage reports I could view in a browser. It would be nice to be able to do all these things with one simple command.
The command: phing.
If you’re familiar with Ant for Java, phing is functionally identical to ant. With a very simple build script, I can run all the unit tests, and generate test result reports and coverage reports in HTML automatically. Then I can fire up my browser and see if any tests failed, or whether we need new tests.
The following are examples of test results reports and coverage reports.
Phing currently requires PHPUnit for unit testing and xdebug for coverage. Someone would have to write a task to use other frameworks such as SimpleTest.
The phing build file is a first step towards automating builds with a build server. A build server can periodically check the project for changes. If new code exists, it will run tests and generate reports for tests, coverage, lint, anything. It can put all this on the web for easy inspection. It can keep versions of the whole project that be can be readily deployed. So if we have a staging and production server, and we stick to deploying ONLY bundles from the build server, it can make deployment and maintenance easier.
Xdebug is an indispensable PHP tool. It is a PHP extension that adds a wealth of capabilities to your PHP development. There are so many features, I’ll dive right in.
var_dump() Replacement
Xdebug replaces PHP’s var_dump() function for displaying variables. Xdebug’s version includes different colors for different types and places limits on the amount of array elements/object properties, maximum depth and string lengths. There are a few other functions…
My favorite part about this: the output is already pre-formatted, so no more echoing <pre> before every var_dump().
Stack Traces For Free
When Xdebug is activated it will show a stack trace whenever PHP decides to show a notice, warning, error etc. The information that stack traces display, and the way how they are presented, can be configured to suit your needs.
Even if you have display_errors off and all errors are sent to a log, the log will still contain the stack traces of any errors.
Function Traces
Xdebug allows you to log all function calls, including parameters and return values to a file in different formats.
This is the ultimate debugging trace. It will create a file with every function, including third-party libraries and PHP internal functions, that was executed along with its arguments. It also displays the execution time the function was called at (where 0 is the start of the request), and the total amount of memory used at that point. What I like to do is insert xdebug_start_trace() in the bootstrap file at the start of the page request. I wrap a condition around it to enable it by giving a secret GET parameter on the query string.
if ($_GET['debugflag'])
{
   xdebug_start_trace();
}
Profiling
Xdebug’s built-in profiler allows you to find bottlenecks in your script and visualize those with an external tool such as KCacheGrind or WinCacheGrind.
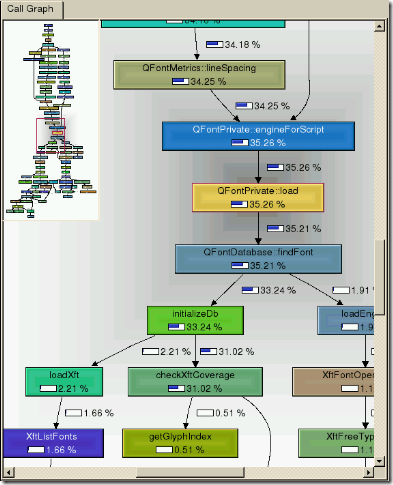
Xdebug, in conjunction with KCacheGrind, can generate a profile call graph which serves as the ultimate profiling report. First, generate a cachegrind file from Xdebug by appending XDEBUG_PROFILE as a GET pararmeter to the URL of the page you want to profile. After the page loads, you will find a cachegrind output file in the output directory (specified in xdebug.ini). Run KCacheGrind and open the output file. You can then generate a call graph which looks something like this:
Limitations:
- KCacheGrind only runs on some kind of Unix. I attempted to run it on Windows/Cygwin unsuccessfully. There is a WinCacheGrind, but it does not offer the call graph feature.
- The call graph feature requires that the source code be local (this info is contained in the cachegrind file). Which means you have to run KCacheGrind on the server, or synchronize the code on the server locally.


