View counts, click counts, hit counts, traffic statistics… The need for analytics and reporting on web products is a must-have. Well, the easiest way to do that is to simply increment a database value each time. The problem is when those counts are coming in hundreds of times per second. Writes are the most expensive queries:
- Writes usually trigger updating an index.
- If you’re using a MyISAM storage engine, the table-level locking can get out of hand.
- Writes are not query-cacheable.
After observing subpar write behavior, I wanted to know just how many of our total writes were for updating statistics?
First, I ran mysqltuner.
% mysqltuner
...
[**] Reads / Writes: 93% / 7%
...
%
So 7% of all queries were writes. That wasn’t bad. Then, I took the binary log of all DML statements for yesterday, starting at midnight. I figured 24 hours was a good sample.
% mysqlbinlog --start-date='2010-06-06 0' binary-log.000152 > cow
I grepped out DML lines, to get rid of the binary log stuff.
% grep -i '^insert' cow > cow2
% grep -i '^update' cow >> cow2
I counted up lines that wrote to our stat tables.
% wc -l cow2
24898 cow
% grep -i -c 'stat_' cow2
20880
Doing the math: 20880 / 24898 = 0.86. About 86% of all writes to our database were for statistics. Which wasn’t too surprising. Most web sites must store and log a lot of data to know where to improve and how users are using the site.
So what do we do?
That’s the subject of another post, but the short answer is that these writes can be batched somehow. Whether the queries are batched with some sort of write-through cache, or job queues, the database won’t suffer from constant write queries.
The MySQL Slow Query Log is a required tool in the database administrator’s toolbox. It’s great for troubleshooting specific issues, but it’s also great for some rainy day application tuning.
My slow query log is in /var/lib/mysqld/db-001-slow.log and records any queries that take longer than 10 seconds (the default value for long_query_time). I can get information out of this log using mysqldumpslow.
Running `mysqldumpslow db-001-slow.log` prints out slow queries sorted by descending execution time. But that’s not useful to me, because any query can get delayed by a blip in the system.
I like running `mysqldumpslow -s c db-001-slow.log` which prints out the slow queries sorted by descending count of times that query occurred. Optimizing a query that takes 10 seconds to execute but occurs a dozen times every minute will be more beneficial than optimizing the query that takes 140 seconds to execute but rarely occurs.
The first time I tried this exercise, I revealed the following 3 types of slow queries (can’t remember the exact order now):
- Queries with lots of logic and joins returning infrequently-changing data.
- Queries using the
curdate()function, which are not query cacheable. - Queries to insert/update a stats table for content view counts.
For #1, I used an in-memory cache to cache the query results. For #2, I replaced the curdate() function with the PHP date() function everywhere I could find it. For #3, I noticed an extraneous index on the stats table, and indexes slow down inserts and updates, so I removed it. For more on handling these types of queries, see my next post.
I was reading up on memcached, when I came across some validation of the Pox Framework object model. In the FAQ, a general design approach to storing lists of data is described.
Storing lists of data into memcached can mean either storing a single item with a serialized array, or trying to manipulate a huge “collection” of data by adding, removing items without operating on the whole set. Both should be possible.
One thing to keep in mind is memcached’s 1 megabyte limit on item size, so storing the whole collection (ids, data) into memcached might not be the best idea.
Steven Grimm explains a better approach on the mailing list: http://lists.danga.com/pipermail/memcached/2007-July/004578.html
Following the link gives this quote:
A better way to deal with this kind of thing is with a two-phase fetch. So instead of directly caching an array of event data, instead cache an array of event IDs. Query that list, then use it construct a list of the keys of individual event objects you want to fetch, then multi-get that list of keys.
…Another advantage of a scheme like this is that you can update an item’s data without having to read then write every list that contains that item. Just update it by ID (like you’d do in your database queries) and all the lists that contain it will magically get the correct information.
That always feels nice.
Like most people, I did not know much about HTTP Keep-Alive headers other than that they could be very bad if used incorrectly. So I’ve kept them off, which is the default. But I ran across this blog post which explains the HTTP Keep-Alive, including its benefits and potential pitfalls pretty clearly.
It’s all pretty simple really. There is an overhead to opening and closing TCP connections. To alleviate this, Apache can agree to provide persistent connections by sending HTTP Keep-Alive headers. Then the browser can open a single connection to download multiple resources. But Apache won’t know when the browser is done downloading, so it simply keeps the connection open according to a Keep-Alive timeout, which is set to 15 seconds by default. The problem is the machine can only keep so many simultaneous requests open due to physical limitations (e.g. RAM, CPU, etc.) And 15 seconds is a long time.
To allow browsers to gain some parallelism on downloading files, without keeping persistent connections open too long, the Keep-Alive timeout value should be set to something very low, e.g. 2 seconds.
I’ve done this for static content only. Why only static content? It doesn’t really make much sense for the main page source itself since that’s the page the user wants to view.
I’ve mentioned before that by serving all static content on dedicated subdomains, we indirectly get the benefit of being able to optimize just those subdomains. So far, this meant:
- disabling
.htaccessfiles - setting a far-future Expires: header
- avoiding setting cookies on the subdomain
Now we can add to the list: enabling HTTP Keep-Alive headers. The VirtualHost block might look like this now:
    ServerName      static0.yourdomain.com
    ServerAlias     static1.yourdomain.com
    ServerAlias     static2.yourdomain.com
    ServerAlias     static3.yourdomain.com
    DocumentRoot    /var/www/vhosts/yourdomain.com
    KeepAlive On
    KeepAliveTimeout 2

        AllowOverride None
        ExpiresActive On
        ExpiresByType text/css "access plus 1 year"
        ExpiresByType application/x-javascript "access plus 1 year"
        ExpiresByType image/jpeg "access plus 1 year"
        ExpiresByType image/gif "access plus 1 year"
        ExpiresByType image/png "access plus 1 year"
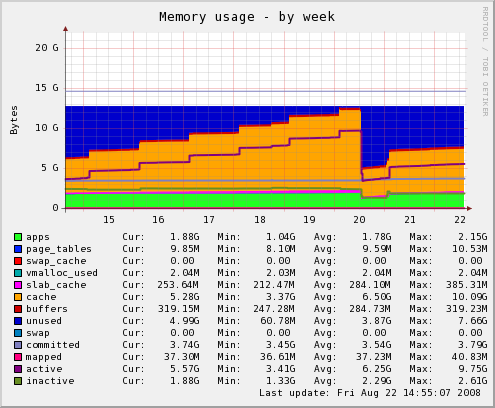
According to these Munin memory graphs, the large orange area is the OS buffer cache – a buffer the OS uses to cache plain ol’ file data on disk. The graph below shows one of our web servers after we upgraded its memory.
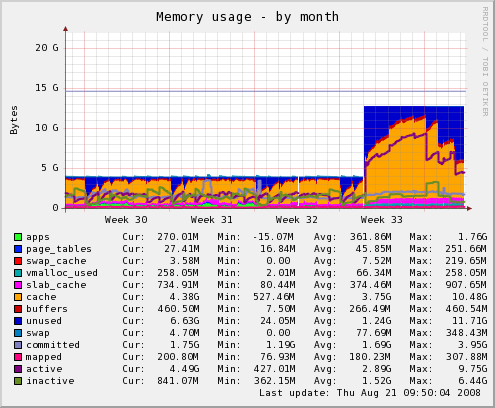
It makes sense that most of the memory not used by apps would be used by the OS to improve disk access. So seeing the memory graphs filled with orange is generally a good thing. After a few days, I watched the orange area grow and thought, “Great! LInux is putting all that extra memory to use.” I thought in my head that maybe it was caching images and CSS files to serve to Apache. But was that true?
Looking At A Different Server
Here is a memory graph from one of our database servers after the RAM upgrade.
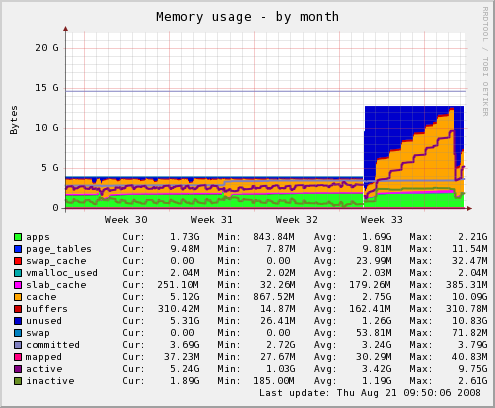
Again, I first thought that the OS was caching all that juicy database data from disk. The problem is that we don’t have 12GB of data, and that step pattern growth was suspiciously consistent.
Looking again at the web server graph, I saw giant downward spikes of blue color, where the buffer cache was emptied. (The blue is unused memory.) These occurred every day at 4 am, and on Sundays there’s a huge one. What happens every day at 4 am? The logs are rotated. And on Sundays, the granddaddy log of them all – the Apache log – is rotated.
The Problem
It was starting to make sense. Log files seem to take up most of the OS buffer cache on the web servers. Not optimal, I’m sure. And when they’re rotated, the data in the cache is invalidated and thus freed.
Here is a memory graph for one of our other database servers.
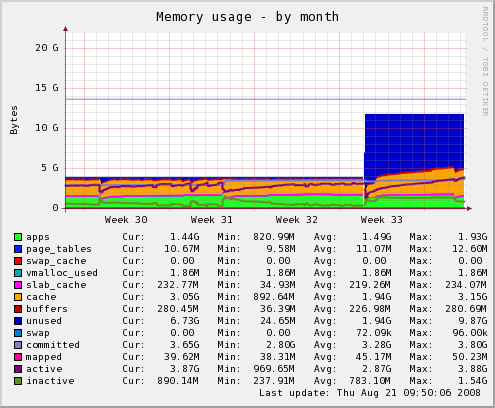
That step pattern growth is missing! In fact, most of RAM is unused. What is the difference between the first database server and this one? The first has the `mysqldump` backup. It occurs every night at 2:30 am, right when those step changes occur on its memory usage graph.
It was clear to me that most of the OS buffer cache was wasted on logs and backups and such. There had to be a way to tell the OS not to cache a file.
The Solution
Google gave me this page: Improving Linux performance by preserving Buffer Cache State. I copied the little C program into a file and ran it on all the `mysqldump` backups. Here is the what happened to the memory usage.
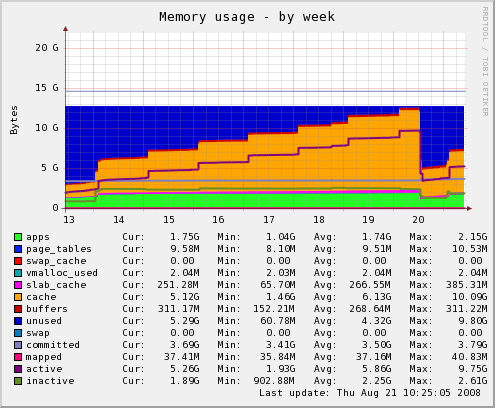
Quite a bit of buffer cache was freed. On that night’s backup, I logged the buffer cache size before the backup and after.
% cat 2008.08.21.02.30.log
Starting at Thu Aug 21 02:30:03 EDT 2008
=========================================
Cached:        4490232 kB
Cached:        5350908 kB
=========================================
Ending at Thu Aug 21 02:30:55 EDT 2008
Just under a gigabyte increase in buffer cache size. What was the size of the new backup file?
% ll 2008.08.21.02.30.sql
-rw-r--r-- 1 root root 879727872 Aug 21 02:30 2008.08.21.02.30.sql
About 900MB.
Did It Work?
I used the C program on that page to ensure no database backups were cached by the OS. I did the same on the web servers in the logrotate config files. A couple days later, I checked the memory graph on the database server that performed the backup. Notice how the buffer cache did not fill up. It looked like the program worked, and the OS was free to cache more important things.
