
Straylight Run
Software, Technology, PHP
 0
0
Xdebug is an indispensable PHP tool. It is a PHP extension that adds a wealth of capabilities to your PHP development. There are so many features, I’ll dive right in.
var_dump() Replacement
Xdebug replaces PHP’s var_dump() function for displaying variables. Xdebug’s version includes different colors for different types and places limits on the amount of array elements/object properties, maximum depth and string lengths. There are a few other functions…
My favorite part about this: the output is already pre-formatted, so no more echoing <pre> before every var_dump().
Stack Traces For Free
When Xdebug is activated it will show a stack trace whenever PHP decides to show a notice, warning, error etc. The information that stack traces display, and the way how they are presented, can be configured to suit your needs.
Even if you have display_errors off and all errors are sent to a log, the log will still contain the stack traces of any errors.
Function Traces
Xdebug allows you to log all function calls, including parameters and return values to a file in different formats.
This is the ultimate debugging trace. It will create a file with every function, including third-party libraries and PHP internal functions, that was executed along with its arguments. It also displays the execution time the function was called at (where 0 is the start of the request), and the total amount of memory used at that point. What I like to do is insert xdebug_start_trace() in the bootstrap file at the start of the page request. I wrap a condition around it to enable it by giving a secret GET parameter on the query string.
if ($_GET['debugflag'])
{
   xdebug_start_trace();
}
Profiling
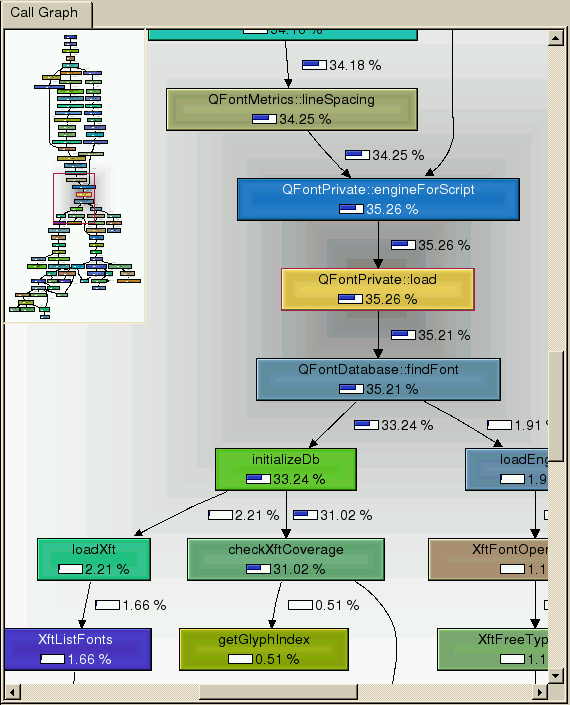
Xdebug’s built-in profiler allows you to find bottlenecks in your script and visualize those with an external tool such as KCacheGrind or WinCacheGrind.
Xdebug, in conjunction with KCacheGrind, can generate a profile call graph which serves as the ultimate profiling report. First, generate a cachegrind file from Xdebug by appending XDEBUG_PROFILE as a GET pararmeter to the URL of the page you want to profile. After the page loads, you will find a cachegrind output file in the output directory (specified in xdebug.ini). Run KCacheGrind and open the output file. You can then generate a call graph which looks something like this:
Limitations:
- KCacheGrind only runs on some kind of Unix. I attempted to run it on Windows/Cygwin unsuccessfully. There is a WinCacheGrind, but it does not offer the call graph feature.
- The call graph feature requires that the source code be local (this info is contained in the cachegrind file). Which means you have to run KCacheGrind on the server, or synchronize the code on the server locally.
I don’t know if it’s true, but I thought I read somewhere that opening and closing the refrigerator wastes energy. Maybe that’s why, the other day when we were unloading groceries, I caught myself trying to minimize this waste.
Here is the layout of our kitchen. We usually bring in all the groceries from the car and put them down in the Grocery Unloading Area. From here, we grab a handful of items put them away. If some go in the fridge, we open the fridge and put them away.
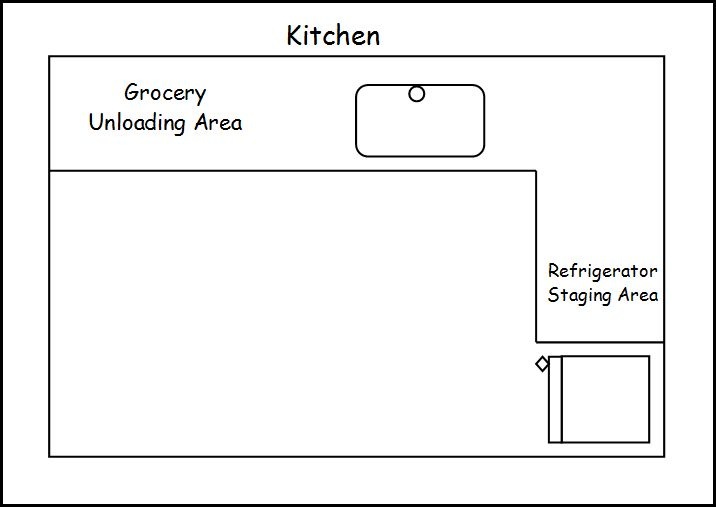
If opening and closing a refrigerator incurs an overhead, just like opening and closing a network or database connection incurs an overhead, this is very inefficient. So I found myself bringing refrigerated items near the fridge, in a Refrigerator Staging Area, or refrigerated items buffer, if you will. This way, I could quickly put away all fridge items, flushing the buffer, and only open the refrigerator once, saving the setup and teardown refrigerator opening costs.
Too much of a stretch? I deal with this kind of crap all day long, so maybe this was inevitable.
This one is filed under “that’s pretty picky, but I guess it couldn’t hurt.”
The Entity Tags (ETags) HTTP header is a string that uniquely identifies a specific version of resource. When the browser first downloads a resource, it stores the ETag. When it requests it again, it sends along the ETag to the server. If the server sees the same ETag, it will respond with a 304 Not Modified response, saving the download.
The problem is that the default format for the ETag (in Apache) is inode-size-timestamp. And the inode will be different from server to server, meaning the server may see a different ETag from the browser, even thought it is in fact an identical file.
The end result is ETags generated by Apache and IIS for the exact same component won’t match from one server to another. If the ETags don’t match, the user doesn’t receive the small, fast 304 response that ETags were designed for; instead, they’ll get a normal 200 response along with all the data for the component. If you host your web site on just one server, this isn’t a problem. But if you have multiple servers hosting your web site, and you’re using Apache or IIS with the default ETag configuration, your users are getting slower pages, your servers have a higher load, you’re consuming greater bandwidth, and proxies aren’t caching your content efficiently.
There is another scenario where it isn’t a problem: if you are using sticky sessions in your load balancer.
In any case, as stated above, it couldn’t hurt to rectify this. So I configured the ETag format in Apache to exclude the inode, and use only size and timestamp.
FileETag MTime Size
So files across servers have the same ETag.
Editor’s note: This post formed the basis of the Front-End Optimization talk I’ve given in the past.
You’ve programmed websites for years, know the ins & outs of PHP, MySQL, why are Javascript and CSS files such a big deal? You put them in a directory, and link to them from your pages. Done. Right?
Not if you want maximum performance.
According to the Yahoo Exception Performance team:
…Only 10% of the time is spent here for the browser to request the HTML page, and for apache to stitch together the HTML and return the response back to the browser. The other 90% of the time is spent fetching other components in the page including images, scripts and stylesheets.
So static content is very important. The same Yahoo people provide us with a comprehensive list of Best (Front-end) Practices for Speeding Up Your Website. IMO, some of the rules are more important than others, and some are more easily achieved. Leaving aside hardware solutions (static server, CDN, etc.) for now, let’s look at six of the rules:
- Rule 1: Make Fewer HTTP Requests, or combine files. The less downloads the better. Simple file concatenation would do. Our goal is at most one Javascript and one CSS file per page.
- Rule 3: Add an Expires Header, or every static file must accompany a time-stamp so we can take advantage of the HTTP Expires: header. A time-stamp in the GET parameters might work, but some say that some CDN’s and browser/version/platform combinations will not request a new file if the query string changes. A better solution would be to put the time-stamp in the filename somewhere.
- Rule 4: Gzip Components. This is easily achieved by enabling
mod_deflatein Apache. - Rule 9: Reduce DNS Lookups. Okay, the real value in this rule is introducing parallel downloads by using at least two but no more than four host names. This is better explained here.
- Rule 10: Minify JavaScript, or at the least strip out all whitespace and comments. There are more sophisticated compressors out there that replace your actual variables with shorter symbols, but the chances of introducing bugs is higher.
- Rule 12: Remove Duplicate Scripts, which as they say is more common than you think.
Rule 3 is a matter of configuring Apache. How to achieve the other five?
As I see it, there are three broad ways to achieve them.
- Handle every request in real-time. This means using a PHP file to serve the files (e.g.
<link rel="stylesheet" type="text/css" href="custom_handler.php?file1.css,file2.css" />or something like that). It can also mean usingmod_rewriteto direct incoming requests for CSS and Javascript to go to a PHP script. Either way, there is processing on every page load. Caching the end-product helps. Still, there must be a better way. - Use a template or view plugin. If you are using a templating system to dynamically generate your HTML, you can use some sort of plugin or function to read in a list of static files, check their last-modified times, and if changed build a combined, minified, time-stamped output file to serve up. This is better than method #1 because by the time the page is built, there is a static file that is simply served to the browser. Still, there must be a better way.
- The best way is to do it offline. This means a job that checks static files to see if they’ve been modified. If so, it processes the files and builds the output file that is directly served to the browser. This job could be run in cron, or run manually by developers, but the best way is to make it a part of the build server.
Don’t have a build server? That’s a whole other topic.
In any system, the biggest bottlenecks will usually be related to I/O. What this means practically is two things:
- Memory is faster than disk.
- Disk is faster than network.
But moving across the boundaries of memory, disk, and network is usually cumbersome. For example, storing things on disks is programmatically easy, but slow. Storing things in memory, in a persistent way, can be hard. This is more true for a shared-nothing architecture like PHP rather than Java, so you may have to deal with some shared memory libraries and SysV IPC-style calls.
Enter tmpfs, the linux shared-memory file system. You can mount it just like ext3, create files, and otherwise treat it like a normal disk, but it’s in memory! Awesome!
On RHEL, Fedora, CentOS – not sure about others – there is a tmpfs drive mounted under /dev/shm by default. One other note: since it is memory, its contents will be lost upon reboot. I usually re-create any directories I need in the /etc/rc.d/rc.local script. Note, however, that this is the last file to run on boot, so if you have a service or daemon that assumes a folder in /dev/shm, you will need to create it in the service’s startup script (usually in /etc/init.d).
 Back to top
About Me
 Gerard Sychay is a software developer in beautiful Cincinnati, OH, and partner at Differential. Nowadays, I do most of my blogging at the Differential blog.


